AssaySentinel.jl
Know when the measurement changed before the science does.
A Julia instrument for scientists, assay developers, biostatisticians, clinical laboratory researchers, and physicians doing measurement-quality or method work. It watches the measurement process — instruments, reagent lots, calibrations, batches, controls, and distributions — and reconstructs a dated, uncertainty-aware, plotted, provenance-complete account of whether that process changed.
A result is stored as a system, not a bare number: instrument, lot, calibration, batch, uncertainty, units, controls, processing history, and provenance travel together. analyze → explain → report is the intended path from a history to an auditable reconstruction.

Ingest a history, run an explainable detector bank, then reconstruct, explain, and report.
First reconstruction
using AssaySentinel

data = showcase_dataset()
result = analyze(data.stream)
println(result)
explain(result)
report(result, "assay-report.html")
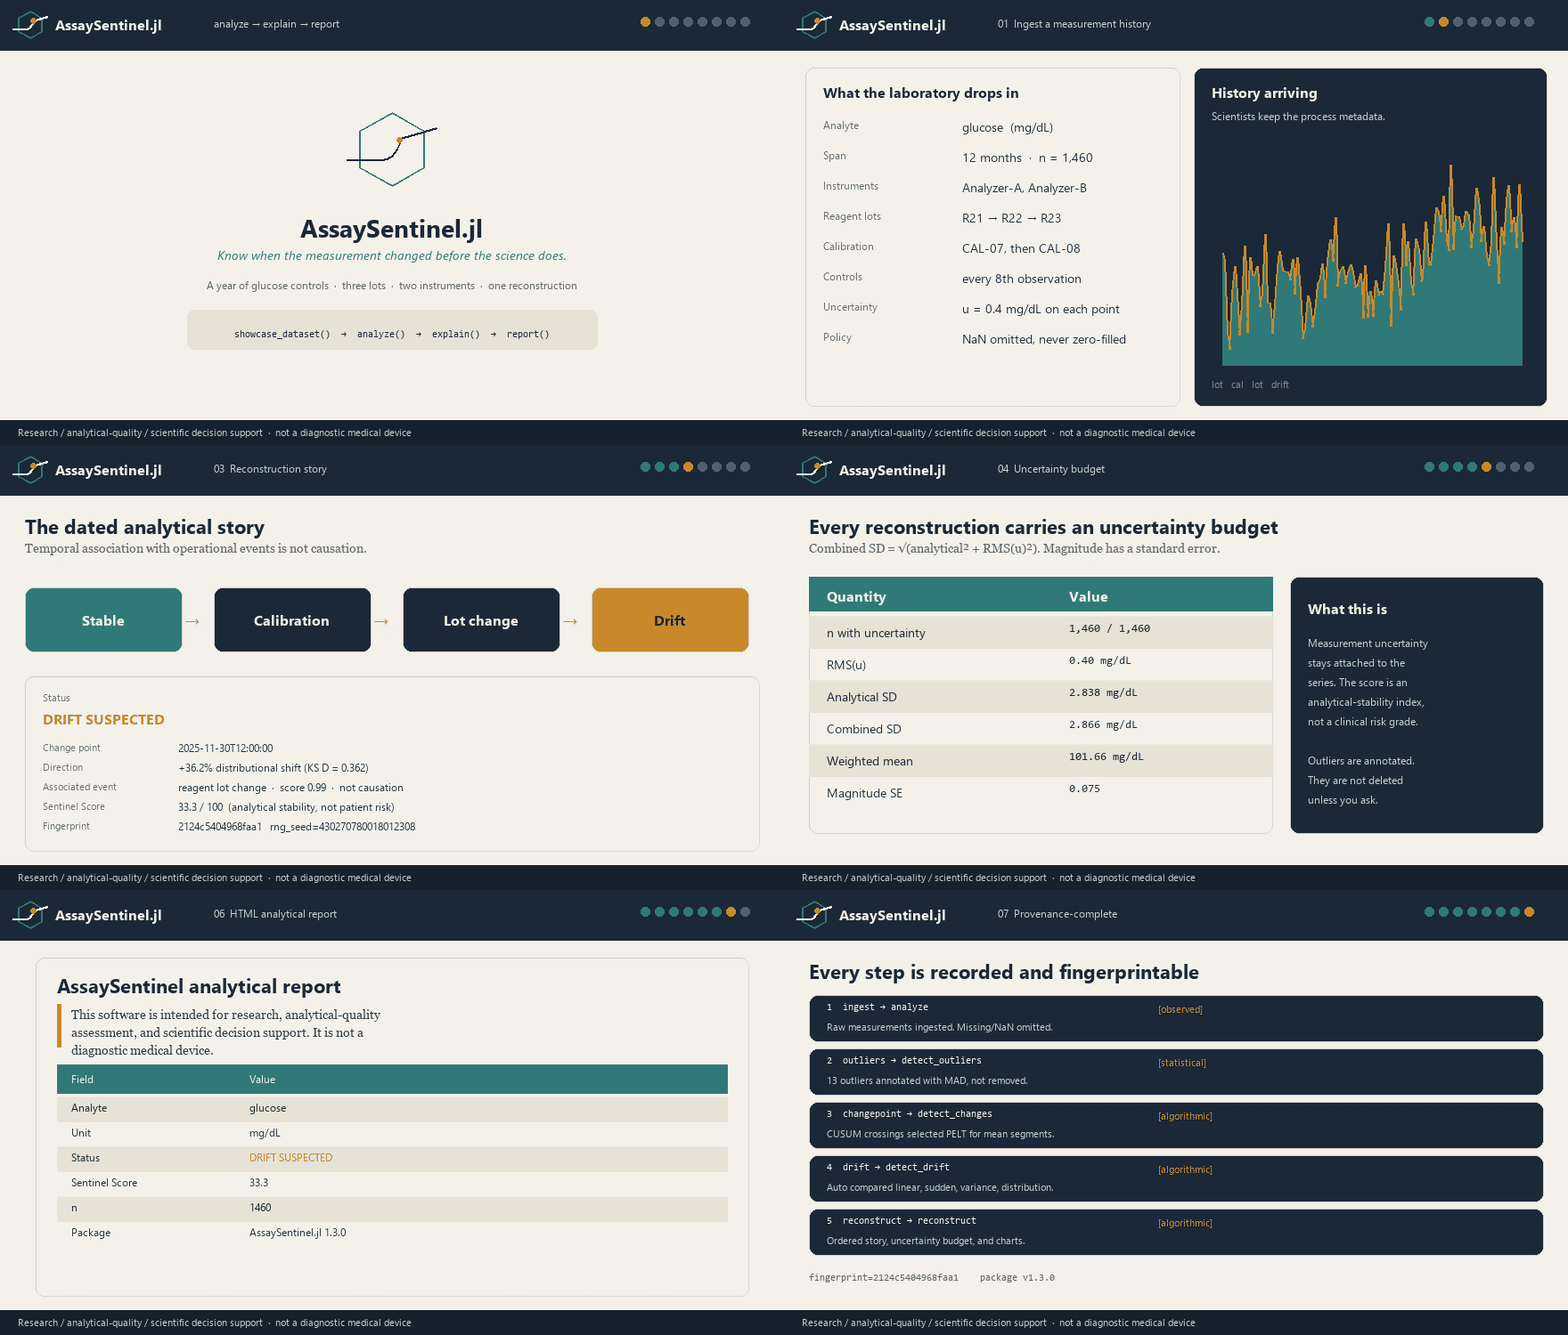
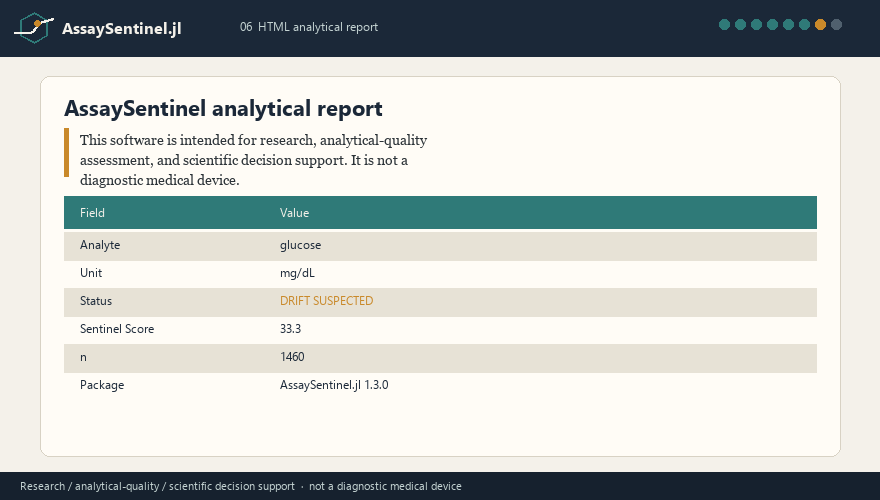
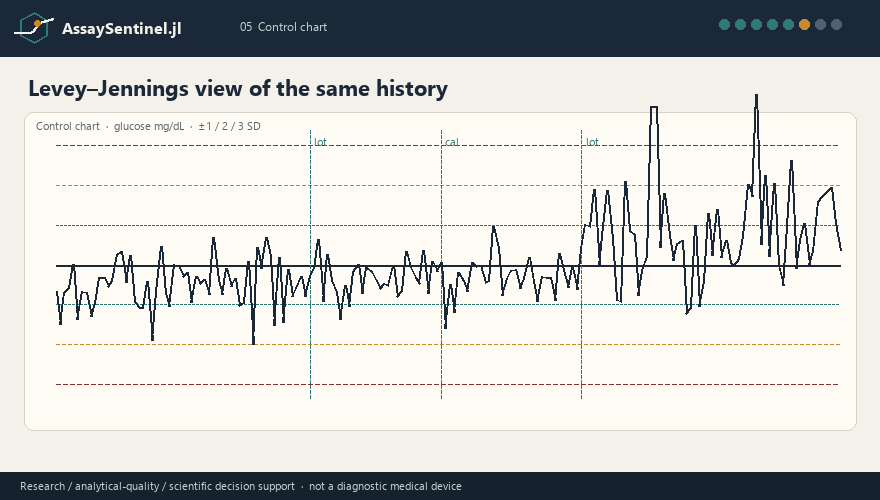
showcase_dataset() is twelve months of synthetic glucose controls: three reagent lots, two instruments, a calibration event, gradual drift, a variance shift, and a handful of control failures. The HTML report is the same object explain narrates.
Install until General registration merges:
using Pkg
Pkg.add(url="https://github.com/theworker02/AssaySentinel.jl")
After the General registry PR is merged, Pkg.add("AssaySentinel") will work. The core package is stdlib-only.
What it answers
- Did this instrument begin drifting?
- Did a reagent lot change alter the measurement distribution?
- Did a calibration curve shift?
- Is this batch statistically inconsistent with previous batches?
- When did the change most likely begin?
- How confident are we, and can the conclusion be reproduced?
It does not diagnose patients, label disease, or independently determine treatment. Severity labels (info, watch, warning, critical) and the Sentinel Score describe the analytical process, not clinical risk.
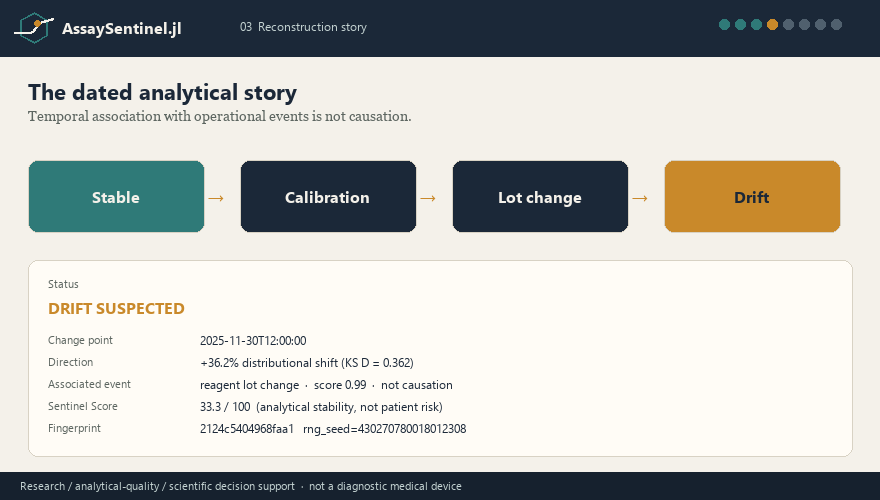
The pedagogical chain scientists read first: Stable → Calibration → Lot change → Drift.
Walk through the docs
Get a reconstruction
Quickstart and the examples page run analyze, explain, and report on synthetic streams.
QC and drift
QC, drift / change-points, and streaming sentinels for ongoing surveillance.
Lots, sites, methods
Comparisons, studies and panels, calibration, batches, and reference intervals.
Methods and proof
Statistical methods, validation, provenance, and bibliography.
Markdown equivalents: Quickstart, Examples, Quality control, Drift and change points, Streaming, Method and instrument comparison, Calibration, Batch effects, Reference intervals, Statistical methods, Validation, Provenance and reports, References, API, Extensions.
Live site
Published docs: https://theworker02.github.io/AssaySentinel.jl
Rebuild locally on save:
julia --project=docs docs/live.jlCitation and funding
See CITATION.cff. If you use AssaySentinel in research, cite the package and the statistical methods you invoked.